Capacitors · Volume 13
Non-Ideal Behaviour, Failure Modes, and How to Measure a Capacitor
13.1 The datasheet describes a stranger
A datasheet describes an idealised part: brand new, at 25 °C, at one blessed test frequency, at one test voltage, measured on a laboratory bridge that costs more than a used car. The capacitor in a technician’s hand is none of those things. It is fifteen years old, sitting on a board that runs at 70 °C, carrying an amp of ripple at 100 kHz, biased at half its rating, and it has been flexed twice during rework. The number silk-screened on its side and the number printed in the catalogue describe a component that no longer exists.
This is the bench volume. Earlier volumes built the theory — the real-capacitor volume established ESR, ESL, dissipation factor, self-resonance, and dielectric absorption as concepts; the family volumes explained why an electrolytic dries out, why a Class II ceramic sags under DC bias, why a tantalum can ignite. Here those non-idealities stop being ideas and become readings on an instrument. The question is no longer “what does the physics say” but “what is this part, right now, and how does one find out.” The answer is always the same: measure it, at the right frequency and the right bias, and trust the meter over the printing.
13.2 The DMM capacitance range: convenient and nearly useless
Almost every mid-range digital multimeter (DMM) now has a capacitance range, and it is the first thing a beginner reaches for. It works by a simple trick: the meter pushes a known constant current into the capacitor, times how long the voltage takes to ramp up, and back-computes C from i = C·dV/dt. On a clean film or ceramic capacitor of a few nanofarads to a few microfarads, sitting loose on the bench, it gives a believable value in a second or two. That is the limit of its usefulness, and the limit is worth spelling out because so many diagnoses go wrong here.
The DMM measures at a very low, fixed frequency — effectively a DC step, or a few tens of hertz at most. That means it tells nothing whatever about how the part behaves at the kilohertz-to-megahertz frequencies where it actually works. It measures only capacitance — no ESR, no dissipation factor, no leakage. It saturates or times out on large electrolytics, where the ramp takes too long, and many DMMs simply give up above a few thousand microfarads or report a wildly wrong figure. It is confused by anything in parallel across the part, so it is worthless in circuit. And most treacherously of all, it is fooled by a leaky capacitor: an old wax-paper coupling capacitor (the subject of the paper-cap volume) that is passing a milliamp of DC leakage straight through its degraded dielectric will still ramp up and read very close to its rated capacitance, because leakage and capacitance are orthogonal properties and the DMM only sees the latter. A tech who “checked the caps with the multimeter and they all read fine” has learned almost nothing. The value being right is the least interesting thing about a capacitor.
13.3 The LCR meter: the honest instrument
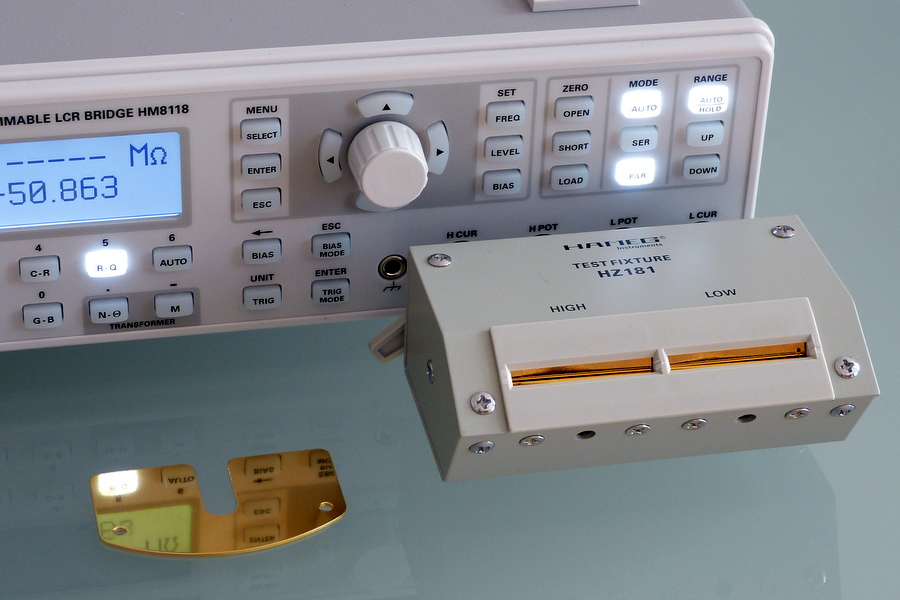
The instrument that actually tells the truth is the LCR meter — L for inductance, C for capacitance, R for resistance. Instead of a DC ramp it applies a small AC sine wave at a selectable frequency, measures both the magnitude and the phase of the resulting current, and from that complex impedance it computes not just capacitance but the loss terms alongside it. A bench LCR meter is the reference tool of the passive-components world, and learning to drive one properly separates guessing from knowing.
13.3.1 Series or parallel: which model the meter fits
The first thing an LCR meter asks — and the first place beginners go wrong — is which equivalent circuit to fit. A real capacitor’s loss can be modelled two ways: as a resistance in series with the capacitance (Cs and Rs, where Rs is the ESR) or as a resistance in parallel with it (Cp and Rp). Both describe the same physical part; they are just two bookkeeping schemes for the same complex impedance, and at a single frequency either can be made to fit. But they are not equally accurate when the meter has finite resolution, and the choice depends on the magnitude of the impedance being measured.
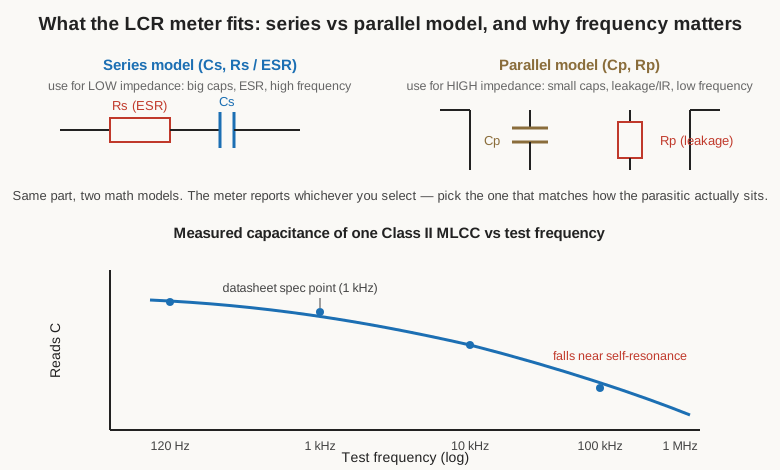
The rule of thumb from the meter makers (Hioki, Keysight, IET) is impedance-based. For low-impedance parts — large-value capacitors, and any measurement dominated by ESR, where the total impedance is below roughly 100 Ω — the series model is correct, because the small series resistance sits right where the model puts it and the meter can resolve it against a small denominator. For high-impedance parts — small-value capacitors and leakage/insulation measurements, above roughly 10 kΩ — the parallel model is correct, because the dominant loss there is the leakage resistance sitting genuinely in parallel with the plates. In the awkward middle decade (100 Ω to 10 kΩ), the honest answer is to follow the component manufacturer’s stated measurement conditions. A practical translation: measure a 470 µF electrolytic in series mode (its impedance at 100 Hz is well under an ohm), and measure a 10 pF C0G in parallel mode (its impedance is megohms). Pick wrong and the loss figure can be off by a large factor even though the capacitance reads nearly the same.
13.3.2 Test frequency: measure it where it lives
An LCR meter offers a menu of spot frequencies — commonly 100 Hz, 120 Hz, 1 kHz, 10 kHz, 100 kHz, and 1 MHz — and the single most important habit in capacitor measurement is to choose the one nearest the part’s operating frequency, not whatever the meter powers up in. A capacitor is not one number; its capacitance, its ESR, and its dissipation factor all move with frequency, sometimes dramatically.
The conventions exist for good reasons. Aluminium electrolytics are specified at 120 Hz (100 Hz in 50 Hz-mains countries) because that is twice the mains frequency — the ripple they were born to filter behind a full-wave rectifier. General-purpose ceramic and film capacitors are specified at 1 kHz. Small ceramics, in the low-picofarad range, are specified at 1 MHz, because at 1 kHz their impedance is so high that a bench meter can barely see them. Measuring a part at the wrong frequency and comparing it to a datasheet value taken at another is one of the most common self-inflicted confusions on the bench. A high-value X7R that reads its full rating at 120 Hz may read noticeably lower at 100 kHz as it approaches self-resonance; the real-capacitor volume treated self-resonance as theory, and here it becomes something an LCR meter can walk a reader straight into by stepping the frequency up and watching capacitance fall and then the part turn inductive.
13.3.3 Test signal level, and the DC bias that tells the truth
Two more knobs matter, and both exist because ceramics lie. The test signal level — the AC amplitude, often selectable from around 0.1 V up to 1 V RMS — changes the reading on Class II ceramics because their barium-titanate dielectric is non-linear even to small AC swings; the standard datasheet condition is 1.0 V RMS, and a measurement taken at a different drive level will not match.
Far more important is DC bias. A better LCR meter can superimpose a DC voltage on its AC test signal, and for Class II ceramics this is not a nicety — it is the only way to get an honest number. As the ceramic volume covered, an X5R or X7R capacitor loses a large fraction of its capacitance when a DC voltage is applied across it, because the bias field partially saturates the ferroelectric domains that supply most of its permittivity. A “10 µF” 0805 rated at 25 V, measured at zero bias on the bench, genuinely reads about 10 µF. Bias it to its actual 12 V or 16 V operating point and it may read 4 to 6 µF — the very capacitance the filter or bypass network was counting on has quietly halved. The only way to know what a Class II ceramic is worth in a circuit is to measure it at the DC voltage the circuit applies: enable bias, run the meter’s OPEN/SHORT compensation with bias active but set to zero, then dial the bias to the operating voltage, wait several seconds for the dielectric to polarise, and read. That reading, not the marking, is the design number.
13.3.4 Four-terminal Kelvin sensing
At the low-impedance end — measuring the milliohm ESR of a good electrolytic or polymer part — the resistance of the test leads themselves becomes a large fraction of the reading. A pair of ordinary probes and their wire might contribute 50–200 mΩ, which swamps the 20 mΩ one is trying to measure. The fix is a four-terminal, or Kelvin, connection, named for Lord Kelvin’s 1861 bridge. Instead of two wires it uses four: one pair forces the test current through the part, and a second, separate pair senses the voltage right at the component’s body. Because the sense wires carry essentially no current, their own resistance drops no voltage and vanishes from the measurement; the meter sees only the voltage across the capacitor itself. This is why a proper LCR meter has four terminals and ships with Kelvin clip leads, and why serious ESR work is impossible with two-wire probes. The same principle underlies the four-terminal ESR meter below.
13.3.5 Reading C, DF, ESR, and Q
Having applied its AC signal, the meter resolves the complex impedance into a capacitance and a loss term, and offers the loss in whichever dialect the user prefers. ESR (equivalent series resistance) is the loss expressed as ohms in series — the number that matters for ripple heating and decoupling. DF (dissipation factor, or tan δ) is the same loss expressed as a dimensionless ratio, the tangent of the loss angle; it is ESR divided by capacitive reactance, and it is the natural figure for low-loss dielectrics. Q (quality factor) is simply 1/DF, the figure the RF crowd prefers, where a high Q means a low-loss capacitor. All three describe one physical quantity — the ratio of energy lost to energy stored per cycle — seen from three professional vantage points, exactly as the real-capacitor volume laid out. A film capacitor might read DF = 0.0003 (Q ≈ 3000); a tired electrolytic might read DF = 0.3, which is another way of saying its ESR has become a serious fraction of its reactance.
13.4 The ESR meter: the fastest bad-cap finder on the bench
The LCR meter is thorough but slow, bench-bound, and it wants the part out of circuit. For the single most common repair job in electronics — finding the dried-out electrolytic that is killing a switching power supply — there is a faster, cruder, and brilliant tool: the dedicated ESR meter.
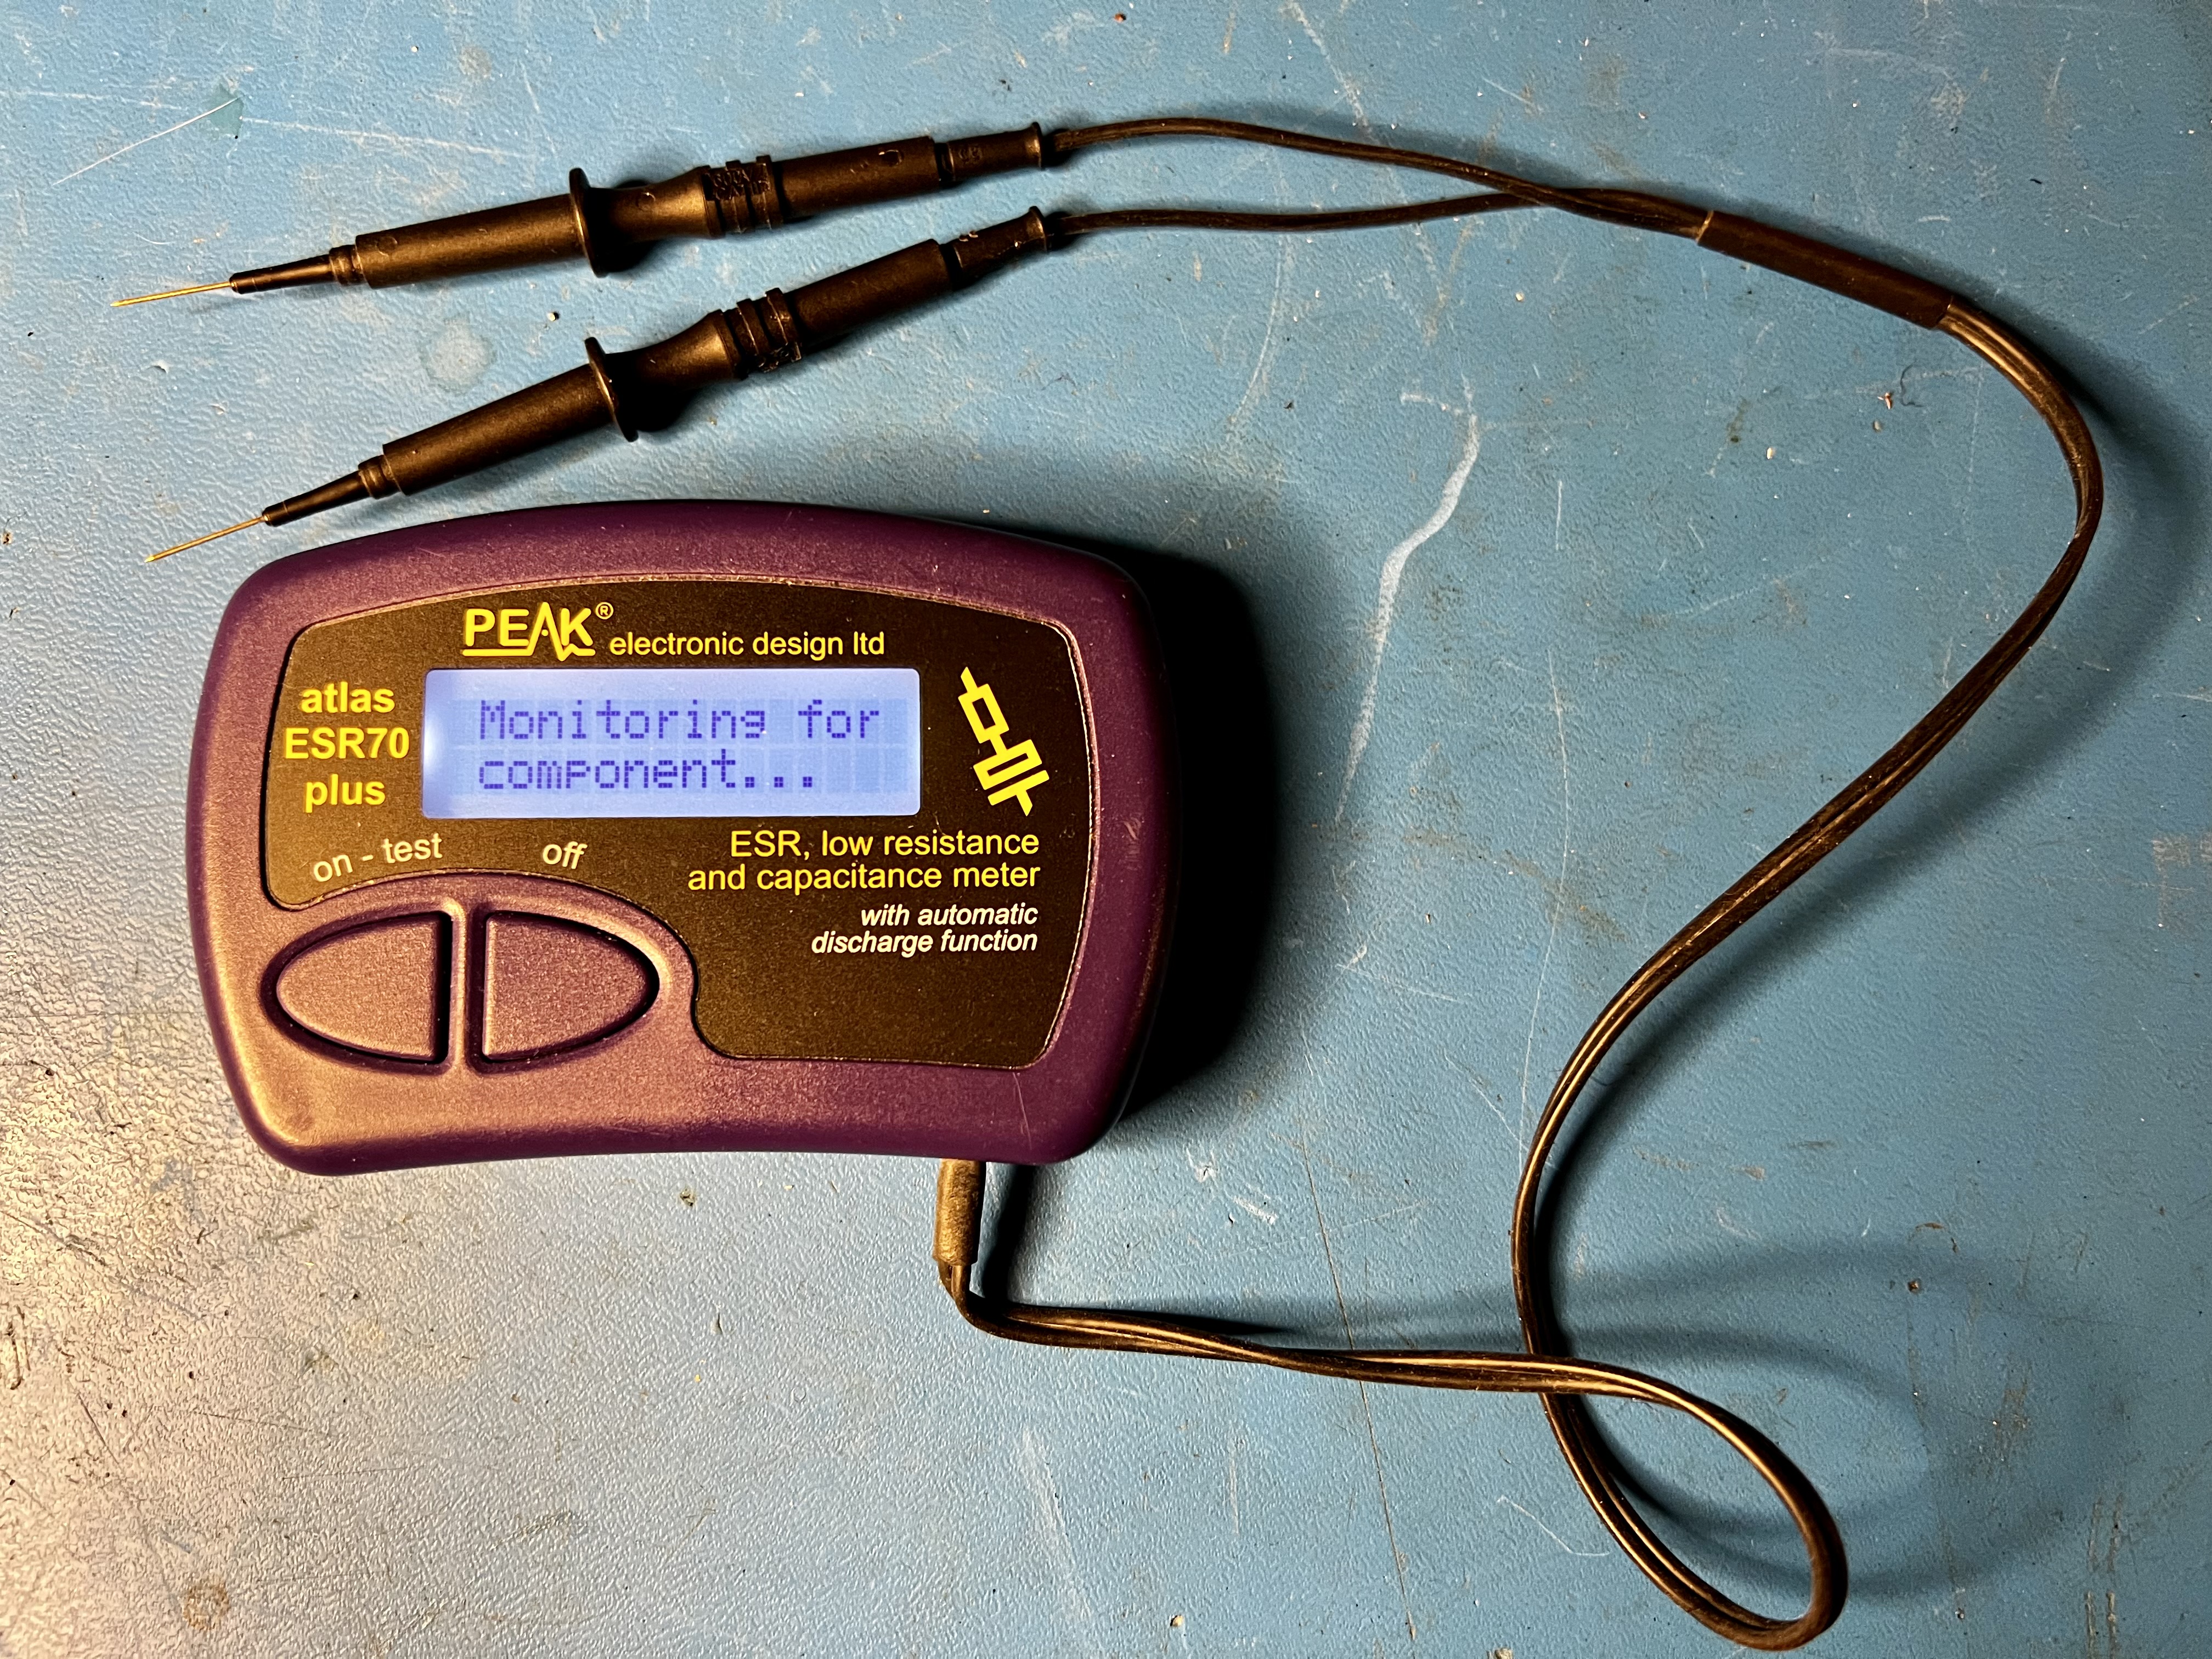
An ESR meter does one thing: it applies a small AC signal at around 100 kHz and reads only the resistive part of the impedance. Two design choices make it powerful. First, the frequency. At 100 kHz the capacitive reactance of any electrolytic bigger than a microfarad or two is a few milliohms — effectively a short circuit — so whatever impedance remains is almost pure ESR. And 100 kHz is not arbitrary: it sits right in the switching band of the supplies where ESR does its damage, so the reading reflects the part under its most demanding real condition. Second, the amplitude: the test signal is kept well under a diode drop, typically 50–100 mV peak. That is the key to in-circuit testing. Because the signal never rises high enough to turn on the silicon junctions around the capacitor — transistors, diodes, chips all stay dark — the meter reads the capacitor’s ESR right there on the board, no unsoldering required. A tech can walk a probe across a row of filter capacitors and, in seconds each, sort the good milliohm parts from the bad multi-ohm ones.
The diagnostic power comes from a happy fact of failure physics, established in the electrolytics volume: as an electrolytic ages and its electrolyte evaporates, ESR climbs long before capacitance falls noticeably. ESR is the leading indicator. A cap that has lost only ten percent of its capacitance — a change the DMM would call fine — may have tripled its ESR, and the ESR meter catches it immediately. This is why a fifteen-dollar meter finds faults that a thousand-dollar DMM cannot even look for. Manufacturer and repair-community ESR charts give the pass/fail thresholds by capacitance and voltage; anything several times above the chart figure is suspect.
13.4.1 The component tester
Adjacent to the dedicated ESR meter is the ubiquitous component tester — the cheap graphic-display gadget, built around an AVR or similar microcontroller, that a maker clips any two- or three-legged part into and gets an identification plus a measurement. Clip in a capacitor and it reports capacitance, ESR, and often a vloss (leakage) figure; clip in a transistor and it identifies the pinout and gain.
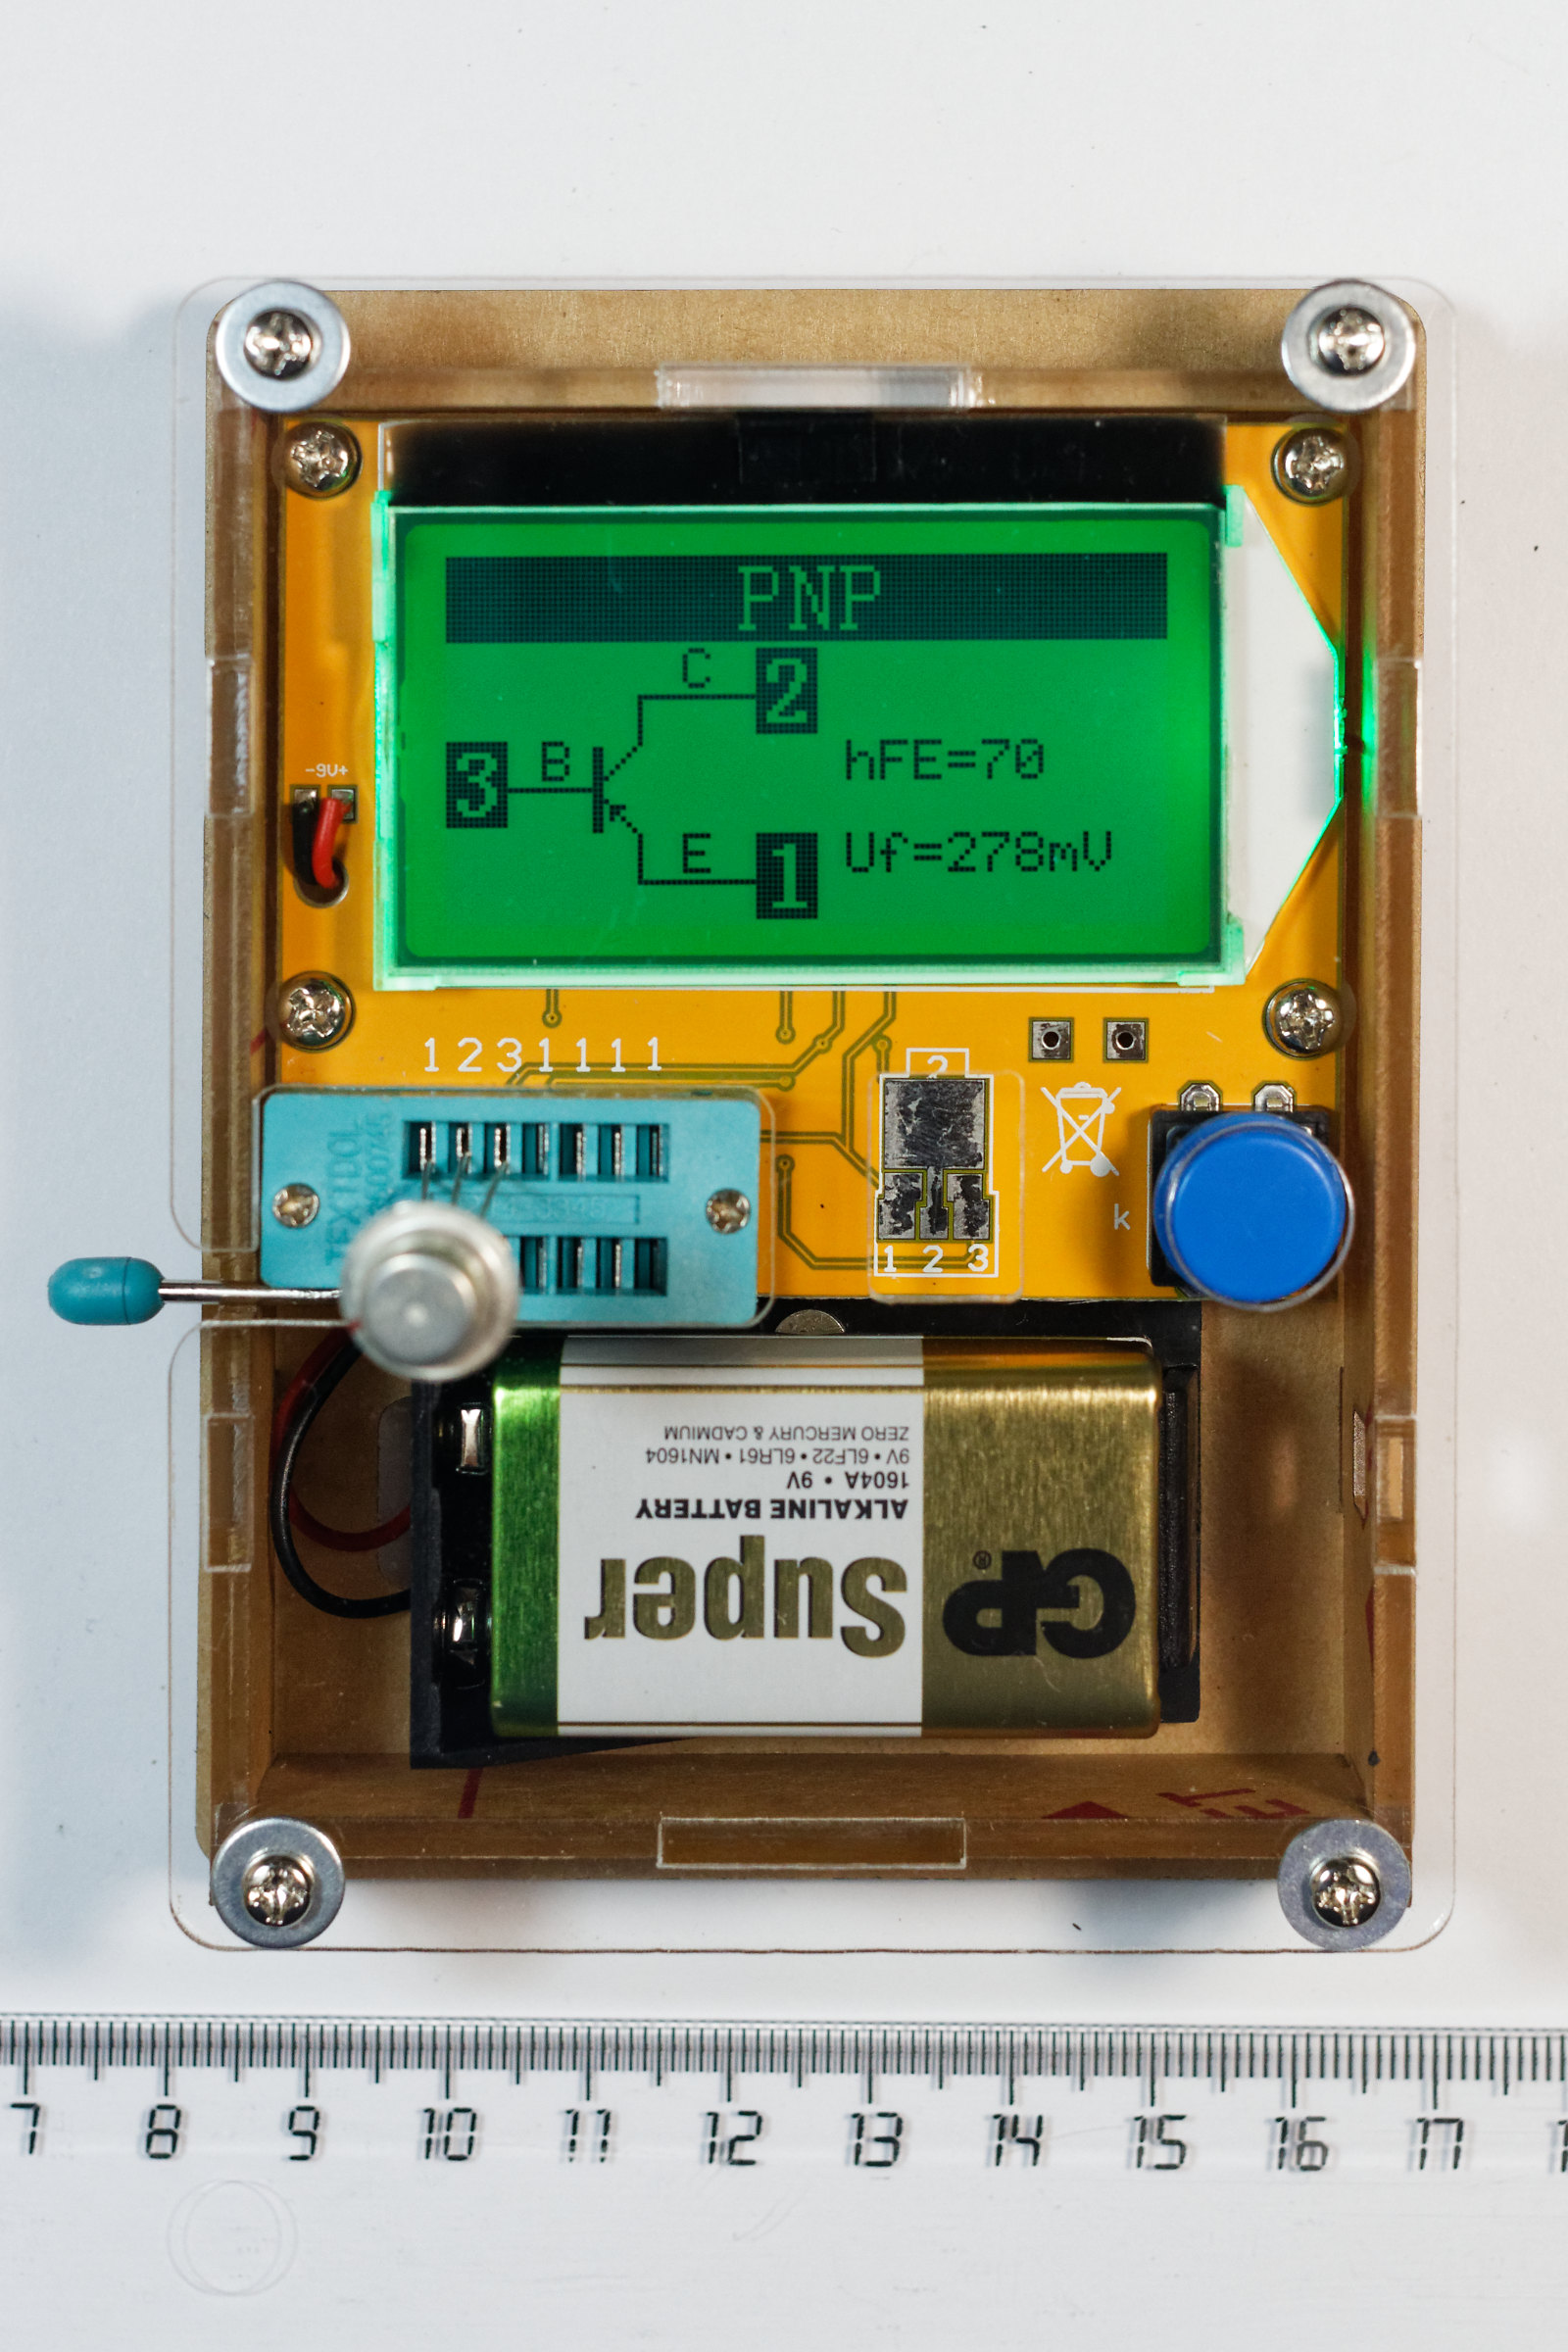
These devices are astonishing value and genuinely useful for sorting a parts drawer, and their ESR figures on loose electrolytics are good enough to catch a plainly bad part. Their limits should be understood, though: they test at a low, fixed frequency and modest accuracy, they cannot apply DC bias, and they are useless in circuit. They are a hobbyist’s on-ramp to ESR thinking, not a substitute for the dedicated meter’s in-circuit ability or the LCR meter’s rigor.
13.5 Leakage and insulation resistance: testing at working voltage
Capacitance and ESR describe how a part passes AC; leakage describes how badly it passes DC it should be blocking. A perfect dielectric passes none; a real one passes a trickle, and a degraded one passes a flood. The failure is invisible to every instrument discussed so far, because they all test with tiny signals — and leakage is a function of the full working voltage. This is the measurement that condemns a vintage paper capacitor and that qualifies a reformed electrolytic.
The tool is an insulation-resistance tester, or megohmmeter (the Megger is the archetype). It applies a high, known DC voltage — ideally at or near the capacitor’s rated working voltage — and measures the tiny leakage current, reporting the result as a very large resistance: the insulation resistance, often specified as the C·R product (megohm-microfarads). A healthy film or ceramic part reads gigohms to teraohms. The critical point, hammered in the paper-cap volume, is that this failure hides at low voltage. A leaky old wax-paper coupling capacitor may read a perfectly correct capacitance on an LCR meter and a plausible resistance on a DMM’s ohms range, then leak milliamps once 300 V of plate supply appears across it in the actual amplifier — dragging the following tube’s grid positive and red-plating it. Only a leakage test at working voltage exposes it. The same test, applied slowly and with a current limit, is how an aluminium electrolytic is reformed after long storage: raising the voltage gradually lets the anode’s oxide layer rebuild and the leakage current taper down, rather than letting a full-voltage inrush punch through a thinned oxide, as covered in the electrolytics volume.
13.6 Dielectric absorption: measuring the ghost
Dielectric absorption (DA), also called soakage, is the most subtle non-ideality and the one with the most elegant bench test. As the real-capacitor volume explained, it is the sluggish component of polarisation: charge that seeped into the dielectric slowly, did not come back out during a quick discharge, and then relaxes back to the plates afterward — a capacitor that seems to charge itself from nothing. It matters wherever a capacitor is discharged and then trusted to stay discharged: sample-and-hold amplifiers, integrators, precision analog-to-digital front ends, and high-voltage safety, where a “discharged” filter capacitor can recover a startling and dangerous voltage minutes later.
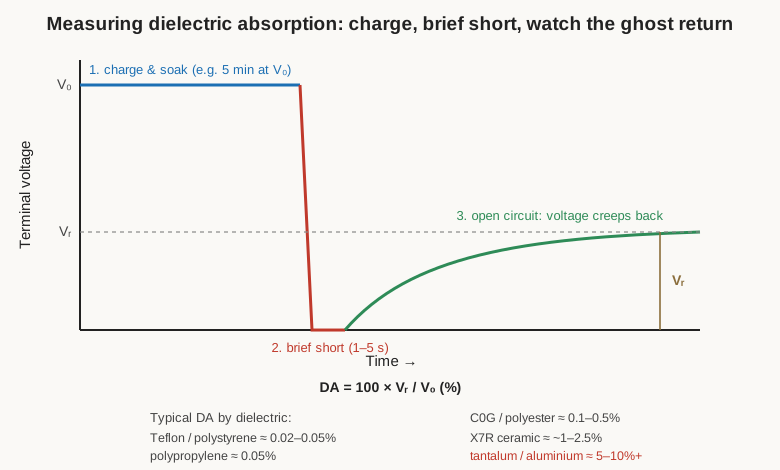
The standard measurement (the IEC method) is a three-step ritual anyone can run with a bench supply and a high-impedance voltmeter. Charge the capacitor to a known voltage V₀ and soak it there for a set time — several minutes — so the slow polarisation fully develops. Briefly short the terminals, for one to five seconds, just long enough to sweep the fast, ordinary charge off the plates and bring the terminals to zero. Then open the terminals and watch: over the following minute the deep-soaked charge relaxes back out and reappears as a recovered voltage V_r. Dielectric absorption is reported as their ratio, DA = 100 × V_r / V₀, in percent.
The spread across dielectrics is large and follows the same ranking that governs which capacitor belongs in a precision analog circuit. Teflon (PTFE) and polystyrene are the aristocrats at roughly 0.02–0.05%; polypropylene sits near 0.05%, which is why it is the default for sample-and-hold and integrator capacitors. C0G/NP0 ceramic and polyester (Mylar) land around 0.1–0.5%. Class II ceramics run to a percent or more, and aluminium electrolytics and tantalums are the worst offenders at several percent to well over ten — which is exactly why nobody builds a precision integrator around an electrolytic.
13.7 Seeing the theory: non-idealities applied on the bench
With instruments in hand, the abstractions of the earlier volumes become things one can watch happen.
DC-bias capacitance loss stops being a curve on a Murata website and becomes a live demonstration: put a Class II 0805 on a bias-capable LCR meter, sweep the bias from zero to rating, and watch the capacitance slide down its derating curve in real time. Do the same to a C0G part beside it and the reading does not budge — the difference between Class I and Class II made visible in one afternoon.
ESR rise with age and temperature is the electrolytic’s whole life story on a meter. Measure a fresh cap and a fifteen-year-old one of the same value and read the difference directly. Then chill the old one with freeze spray and watch its ESR climb further still: the electrolyte gets more resistive as it cools, which is why a marginal supply fails on a cold morning and recovers once warm. That temperature dependence, treated as a number in the electrolytics volume, becomes a thing one causes and observes.
Self-resonance is a frequency sweep away. Step an LCR meter’s frequency up through a bypass ceramic and the impedance falls, bottoms out at the self-resonant frequency where ESL cancels C, then rises as the part becomes a net inductor — the moment a “capacitor” stops decoupling. On instruments with a sweep, the classic V-shaped impedance curve of the real-capacitor volume draws itself.
Dielectric absorption’s circuit effect shows up as an error, not a reading. In a sample-and-hold, DA lets the held voltage drift back toward a previous sample; in a long integrator, it introduces a slow “memory” that corrupts the ramp. An engineer chasing a few millivolts of inexplicable droop in a precision front end is often looking at DA, and the fix is a better dielectric, not a better op-amp.
Microphonics is a non-ideality one hears rather than measures. Tap a Class II ceramic in a high-impedance, high-voltage node while the circuit runs and the piezoelectric barium titanate turns the mechanical tap into a voltage spike — audible as a tick in audio gear, visible as noise on a scope. It is the ceramic dielectric’s ferroelectric nature (the same nature behind its DC-bias loss) speaking out of turn, and it is why C0G, not X7R, goes in a sensitive analog node.
13.8 Derating and reliability: the bathtub curve
Beyond any single measurement lies the statistical question: how long will the part last, and how often will it fail? The vocabulary here is shared across all electronics reliability work, and capacitors sit squarely inside it.
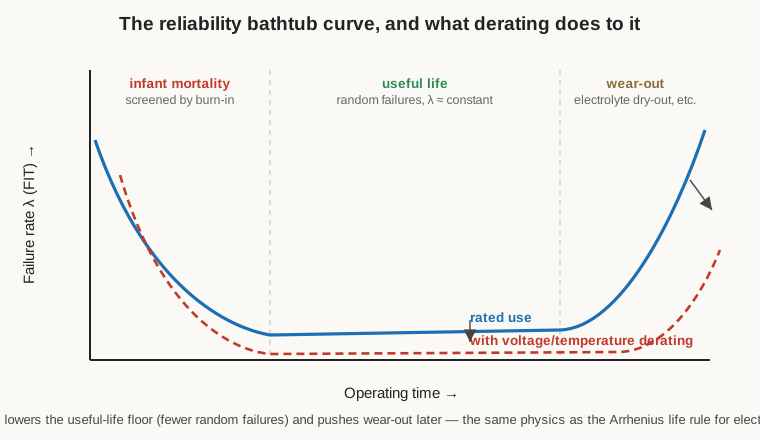
The failure rate of a large population of parts over time traces the classic bathtub curve, three regimes in one profile. Infant mortality is the steep early drop: a small fraction of parts carry manufacturing latent defects — a void in a tantalum pellet, a marginal MLCC — and fail quickly. Makers weed these out with burn-in, running parts hot and biased before shipment so the weak ones die on the factory floor rather than in the field. The long flat middle is useful life, where the survivors fail only at a low, roughly constant random rate. The rising tail is wear-out, where a genuine ageing mechanism — electrolyte evaporation in an aluminium cap, most commonly — overtakes the population and the failure rate climbs.
Failure rate is quantified in FIT — Failures In Time — where 1 FIT is one failure per billion (10⁹) device-hours. A part rated at, say, 5 FIT is expected to see five failures across a billion hours of operation. The related MTBF (mean time between failures) or MTTF is the reciprocal-flavoured figure; a subtlety worth stating because it is so widely misread: MTBF is not the age at which a typical part dies. It is the point at which reliability has decayed to 1/e ≈ 37%, meaning only about 37% of a population survives to the MTBF figure. A “100,000-hour” electrolytic is not promised to run eleven years; that number is a rating point tied to a specific temperature and ripple condition, and it halves for roughly every 10 °C hotter, per the Arrhenius rule from the electrolytics volume.
Derating is the designer’s lever on all of this, and it is remarkably effective. Running a capacitor below its rated voltage and temperature moves it down and to the right on the bathtub curve: fewer random failures during useful life, and a wear-out knee pushed further out. The tantalum literature (Vishay, and the NASA/MIL derating guidance) makes the numbers concrete — a MnO₂ tantalum derated to 50% of its rated voltage, and a polymer tantalum to around 80%, drop their predicted failure rate to a small fraction of the un-derated figure and stretch mean life from a handful of years to a century or more. This is why the tantalum volume treats 50% voltage derating not as caution but as a rule, and why “it works on the bench at full rated voltage” is not the same as “it is reliable.” The reliability spread between families is large: C0G ceramic and film parts are effectively immortal in normal use; quality electrolytics wear out predictably; tantalums are reliable only when properly derated and become hazardous when not.
13.9 Failure modes and signatures, by family
Every family fails, and each announces itself differently. Knowing the signature — on the bench and in a circuit’s symptoms — is what turns “one of the capacitors is bad” into “that one, and here is how I know.”
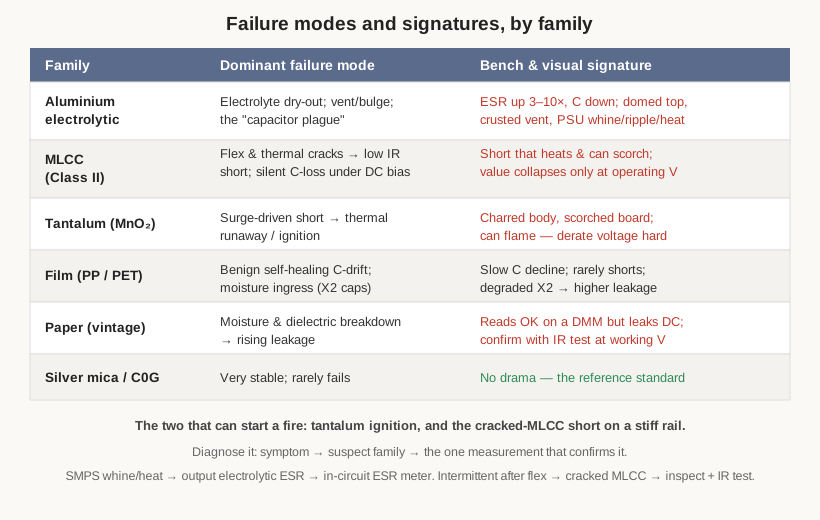
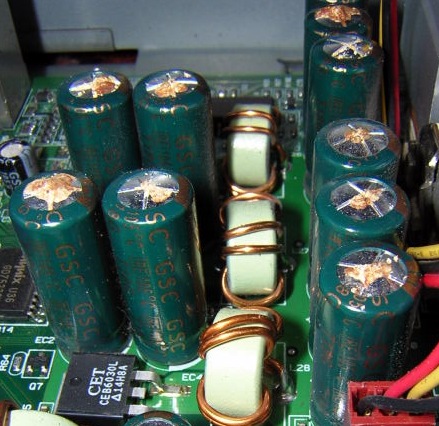
Aluminium electrolytic is the family that wears out on schedule, and its signatures are the most familiar. The slow mode is electrolyte dry-out: ESR climbs, capacitance sags, and a switching supply built around the part begins to whine, run hot, and pass excess ripple. The dramatic mode is the vent — the scored cross or “K” stamped into the can top splits and domes upward, releasing electrolyte as a crust or a smell, the deliberate pressure-relief that stops the can from becoming a grenade. And there is the industrial-scandal mode, the capacitor plague of the early 2000s, in which a stolen, incomplete electrolyte formula corroded from within and burst caps across an entire generation of motherboards. On the bench the diagnosis is ESR first, capacitance second; visually, a domed or crusted top is a conviction without further trial.
MLCC (Class II ceramic) fails in ways the eye usually cannot see, which makes it the most dangerous to diagnose. The signature failure is the crack — a flex crack when board flexure (a connector insertion, a mounting-screw torque, a depaneling snap) puts the brittle ceramic in tension, or a thermal crack from solder-reflow shock. The crack opens a low-insulation-resistance path through the dielectric, and here is the point that surprises people: a cracked ceramic can short, then heat, then scorch. On a stiff, high-current rail the leakage path carries enough current to heat the crack, which lowers its resistance further, which draws more current — a runaway that has genuinely set fire to boards. The “ceramics never burn” belief is false. Manufacturers fight it with flexible terminations and open-mode designs (Kemet, TDK, KyoceraAVX), but the field failure remains. The quieter MLCC failure is not a fault at all but the DC-bias capacitance loss discussed above: a filter that never worked right because the “10 µF” was only ever 5 µF at its operating voltage. A cracked-MLCC symptom is often intermittent — it appears after the board is flexed or heated and vanishes when it relaxes — so the workflow is visual inspection under magnification plus an insulation-resistance test, not a capacitance check.
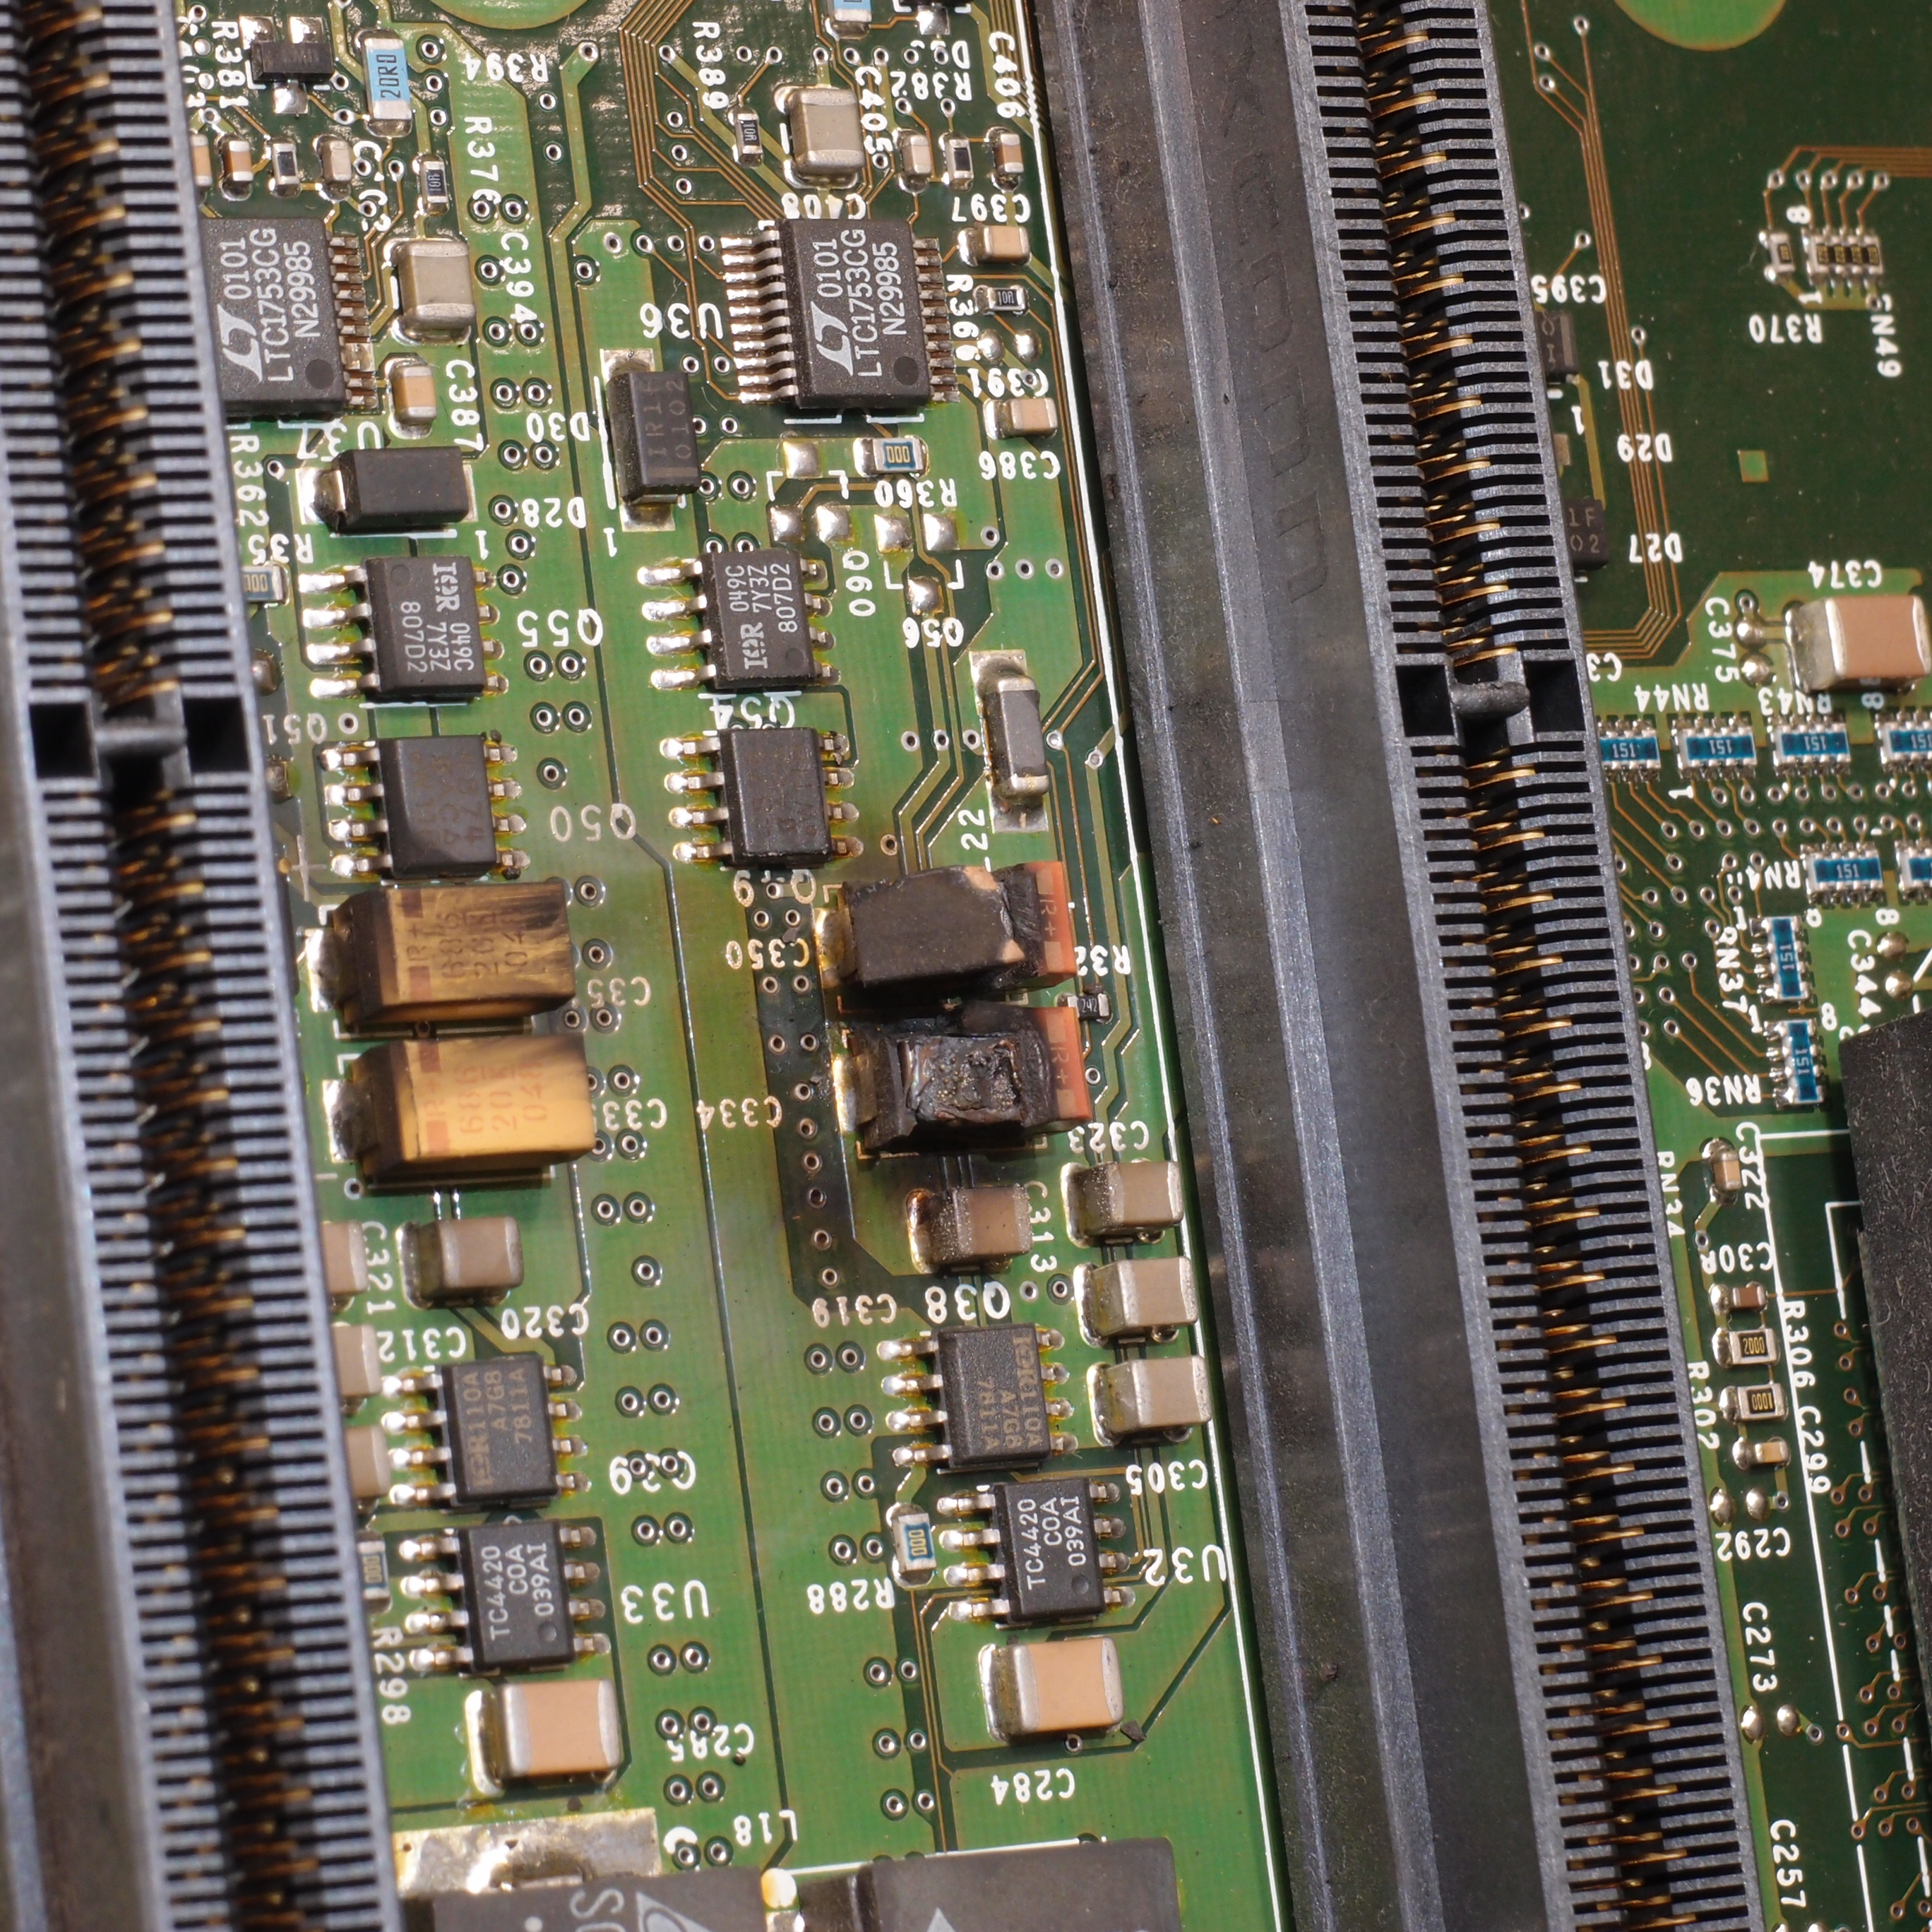
Tantalum (MnO₂) owns the most violent failure mode: ignition. As the tantalum volume detailed, a surge of inrush current through a dielectric flaw can heat the site faster than the MnO₂ cathode can self-heal; the manganese dioxide then liberates oxygen, which meets the tantalum anode in an uncontrolled exothermic reaction, and the part flames. Its signatures are grim and unmistakable: a charred black body, a scorched board beneath, sometimes a hole blown clean through. This is a low-impedance, high-surge failure, which is exactly why tantalums are voltage-derated so aggressively and why polymer-cathode versions (which fail benignly) have displaced MnO₂ in many designs.
Film (PP/PET) is the well-behaved family. Its dominant “failure” is benign: metallized film self-heals, vaporising the metallisation around any dielectric puncture and isolating the fault, at the cost of a tiny, permanent loss of capacitance. A film cap therefore tends to drift slowly downward in value over a long life rather than shorting. The one nastier mode belongs to X2 mains-suppression caps, where years of humidity ingress degrade the dielectric and raise leakage — a slow drift that occasionally ends in a smoky failure, which is why safety agencies watch X2 endurance so closely, as the film volume covered.
Paper (vintage) fails by moisture absorption and dielectric breakdown into ever-rising leakage — the whole subject of the paper-cap volume. Its signature is precisely the trap described earlier: it reads correct capacitance and passes on a DMM, then leaks DC once working voltage appears. The confirming measurement is always an insulation-resistance test at rated voltage.
Silver mica and C0G/NP0 round out the table by barely belonging in it. These low-K, non-ferroelectric parts are extraordinarily stable and almost never fail in normal service; they are the reference against which everything else’s drift is measured. When a circuit needs a capacitor that will read the same in fifty years as it does today, this is it.
13.10 A diagnose-it workflow
The instruments and the failure table combine into a repeatable habit: reason from symptom to suspect family to the one measurement that confirms it.
- Switching supply whining, running hot, or passing ripple → suspect the output or input electrolytic ESR → confirm with an in-circuit ESR meter; a reading several times the pass/fail-chart value convicts it, no desoldering required.
- Fault that is intermittent, appears after the board is flexed, dropped, or heated → suspect a cracked MLCC → inspect under magnification and run an insulation-resistance test; do not trust a capacitance reading, which can look normal.
- Vintage tube gear with a hot output tube, distortion, or drifting bias → suspect a leaky paper coupling capacitor → leakage test at working voltage, because it will read fine at low voltage.
- A precision analog stage with unexplained droop, memory, or slow settling → suspect dielectric absorption in a sample/hold or integrator cap → run the charge/short/recover DA test and, if the dielectric is electrolytic or Class II ceramic, replace it with film.
- A ceramic-filtered rail that measures low capacitance in circuit → suspect DC-bias loss, not a bad part → remeasure on a bias-capable LCR meter at the operating voltage before condemning anything.
- A charred component and a scorched board → the visual signature already names it: a tantalum that ignited, or a cracked MLCC that ran away on a stiff rail.
13.11 Trust the meter, at the right frequency and bias
The through-line of this volume is that a capacitor’s printed value is the least of what one needs to know about it, and the datasheet describes a part that has already ceased to exist by the time it reaches the board. What matters — ESR, leakage, DA, the real biased capacitance, the failure signature — is invisible to the instrument most people reach for, and visible to instruments that cost very little and reward a few good habits. Choose the equivalent-circuit model that matches the impedance. Measure near the frequency the part actually works at. Apply the DC bias the circuit applies, especially to Class II ceramics. Use four-terminal Kelvin leads when milliohms matter, an ESR meter to find tired electrolytics in seconds, and a leakage test at working voltage to convict a paper cap that a DMM swears is fine. Derate for reliability, and read the failure signatures so a bad part names itself. The meter, driven properly, tells the truth; the printing only makes a claim. When the two disagree — and with an aged, biased, in-circuit part they usually do — the meter wins.
Comments (0)